Dashboards
A dashboard is a set of charts and tables that an agent builds and keeps fed with data. You ask for it in chat. Dashboards exist only in General purpose workspaces.
Ask the Agent to Build the Dashboard
The web app has no dashboard editor. Open a chat with the agent. Ask for a view of your data. For example, send "Create a dashboard of the results from this task." See Send your first chat if you have not chatted yet.
The agent uses its built-in dashboard-creator skill. A skill is a saved set of instructions that an agent loads for a task. The agent computes every value first, then publishes the values. AgentZ stores and shows the data. It does not transform it.
A widget is one chart or table on a dashboard. A widget definition cannot change after the agent creates it. To fix a wrong definition, the agent deletes the dashboard and creates it again.
Open a Dashboard
- Select Dashboards in the workspace sidebar. The page opens the first dashboard.
- Pick another agent or dashboard with the two pickers at the top left.
- Pick a period with the date range picker at the top right.
- Click the refresh button beside the date range picker. The page loads the newest data.
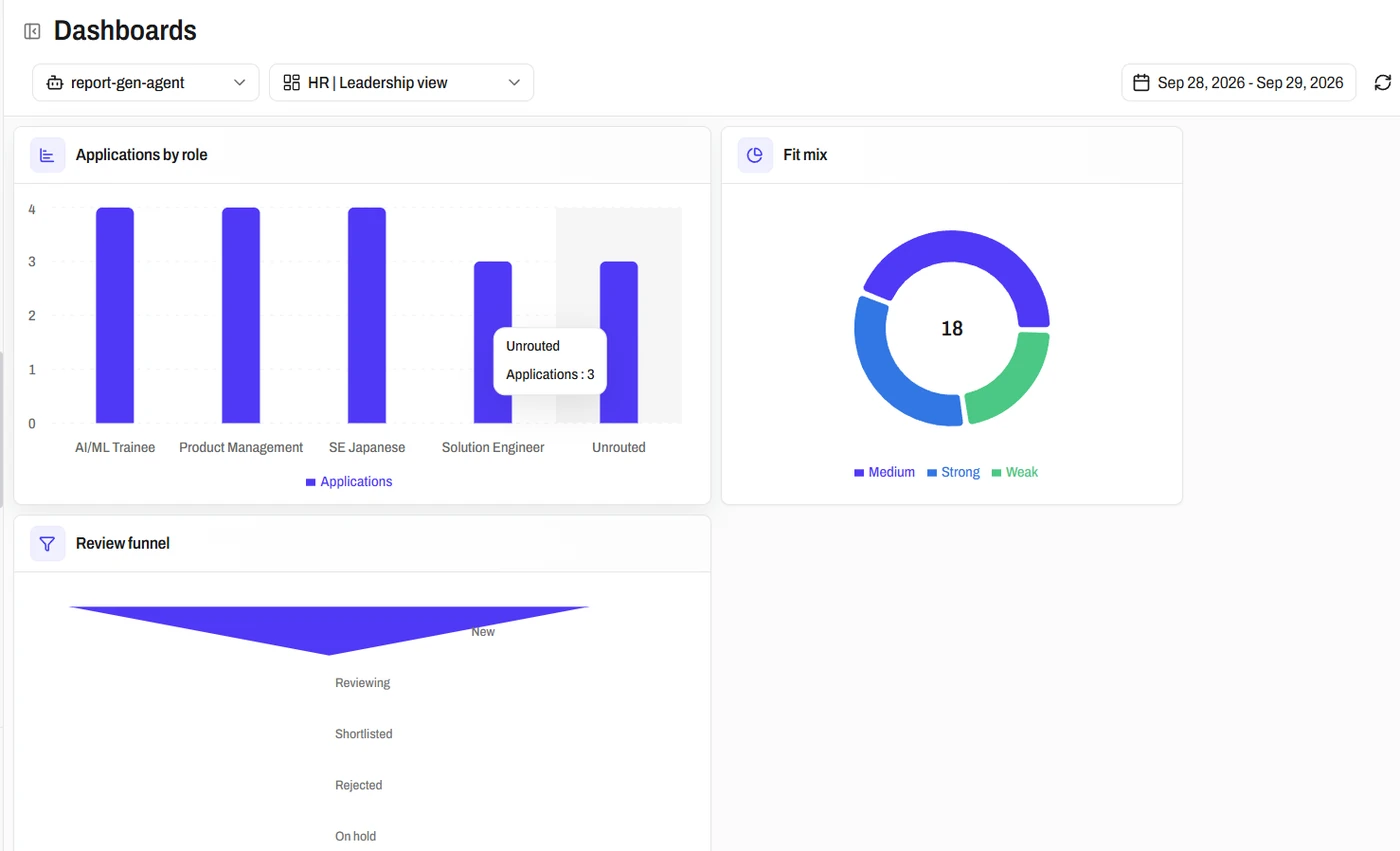
The page shows "No dashboards" until an agent creates one. The agent publishes new data to update a dashboard.
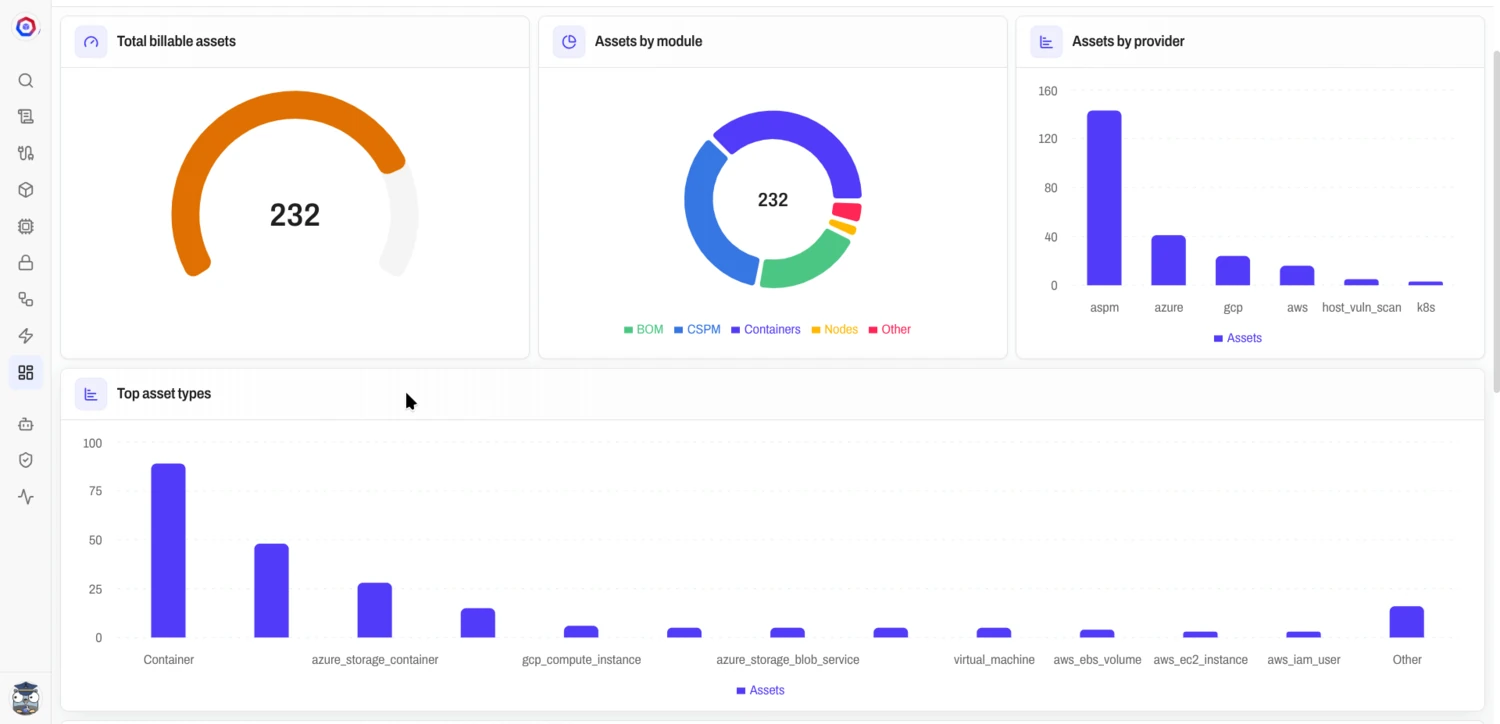
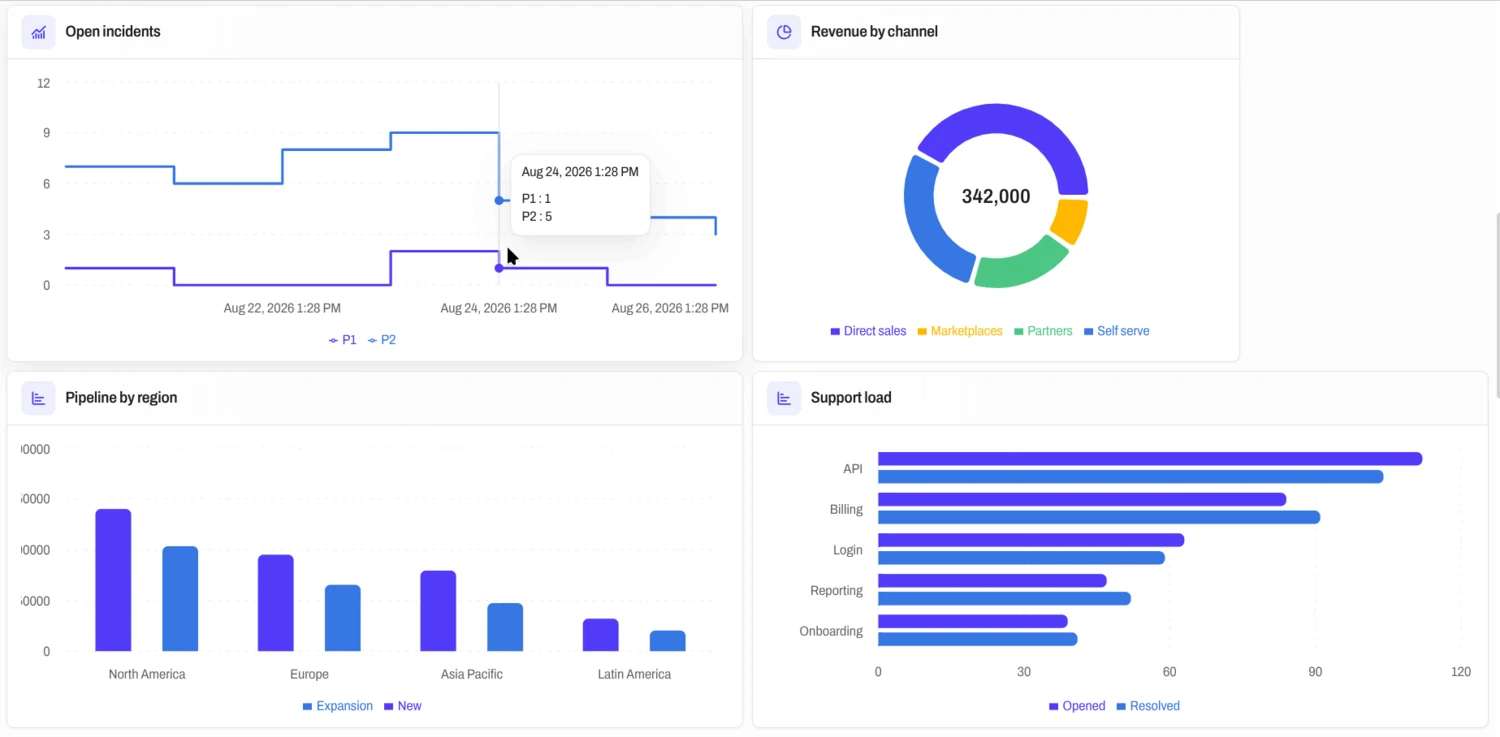
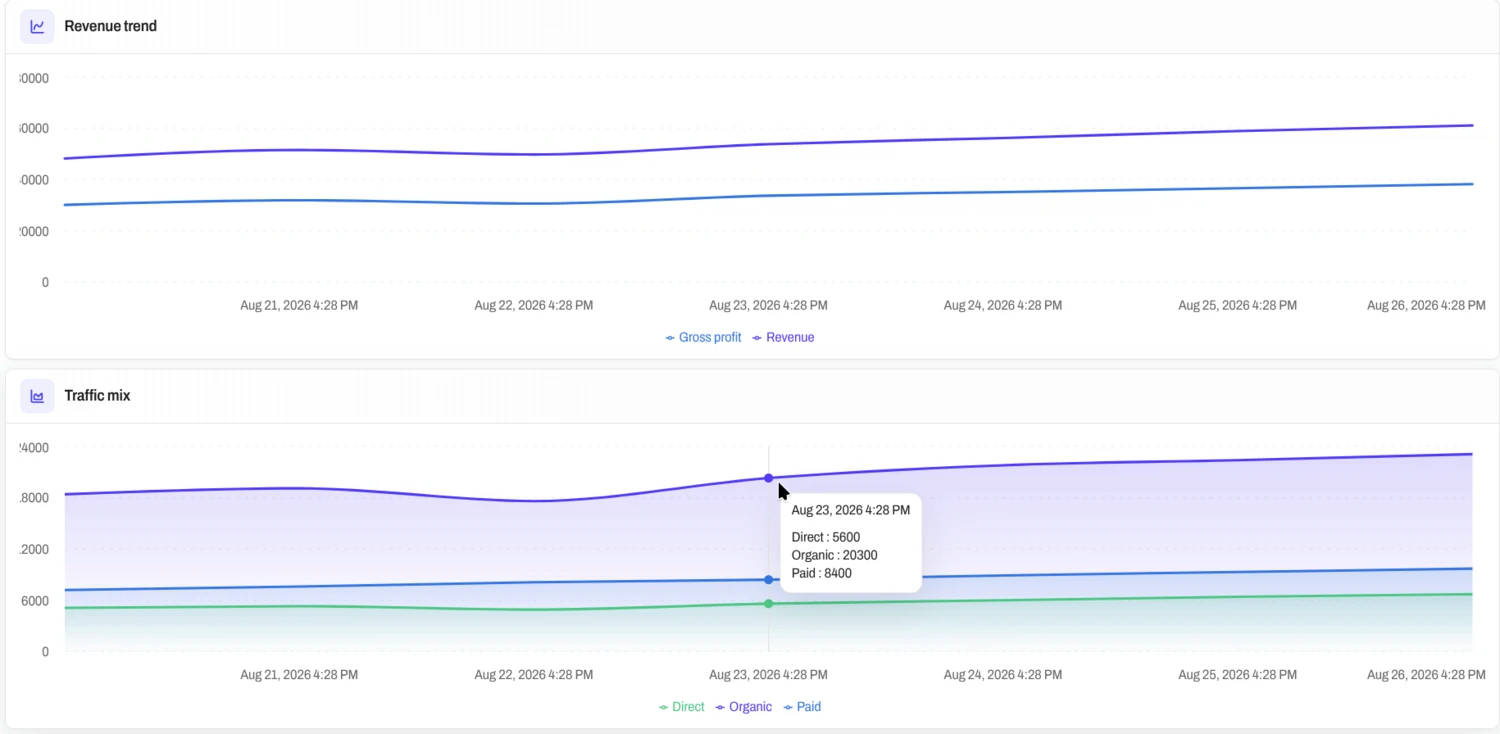
Twelve Widget Kinds Show Your Data
| Kind | What it shows |
|---|---|
line, area, step | Values over time, with 1 to 5 series |
bar, horizontal_grouped_bar | Values by category, with 1 to 5 series |
pie | The share of each category |
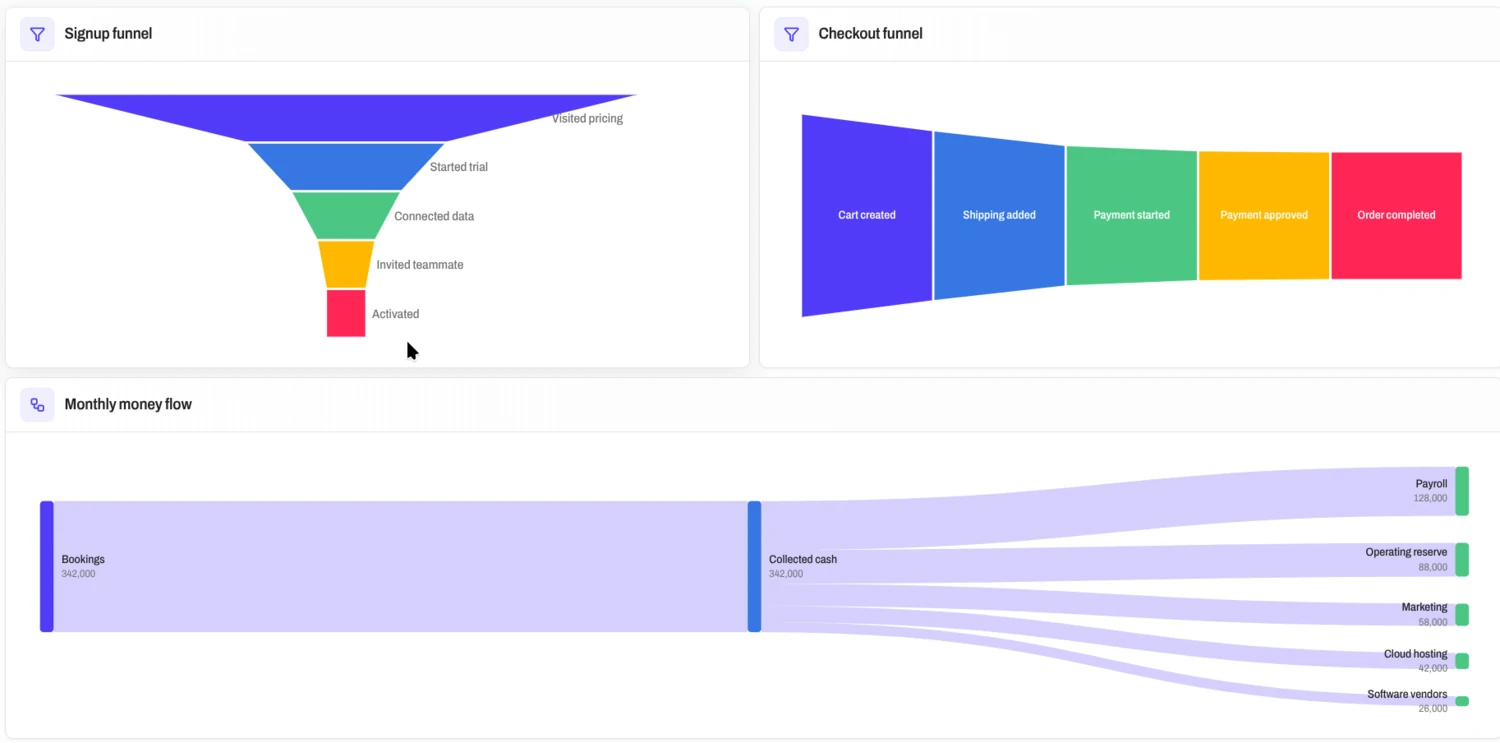
funnel, horizontal_funnel | Stages in order with falling values |
sankey | Flows from a source to a target |
scatter | Points on an x axis and a y axis |
gauge | One value with a minimum, a maximum and thresholds |
table | Rows with 1 to 12 columns |
Each widget is full, half or third width. A time-based widget keeps rows of data, called records, and each record has a timestamp. The date range picker filters them. A latest-value widget keeps only the newest values and replaces them on each publish.
Example Dashboards Show What an Agent Can Build
Default Limits Cap Each Dashboard
- 25 dashboards for each agent
- 24 widgets for each dashboard
- 100 records for each publish
- 256 KiB for each publish request
- 30 days of retention for time-based data
A self-hosted install can use other values. See Limits.
Next Step
Continue with Evaluations.